Trend Exhaustion MT5 Indicator
The Trend Exhaustion MT5 Indicator measures the declining force behind a price move. Think of it this way: price can keep climbing, but if each push higher requires more effort and produces smaller gains, the trend is aging. This indicator quantifies that aging process. It typically combines elements of rate-of-change analysis with volatility measurement. Some […]
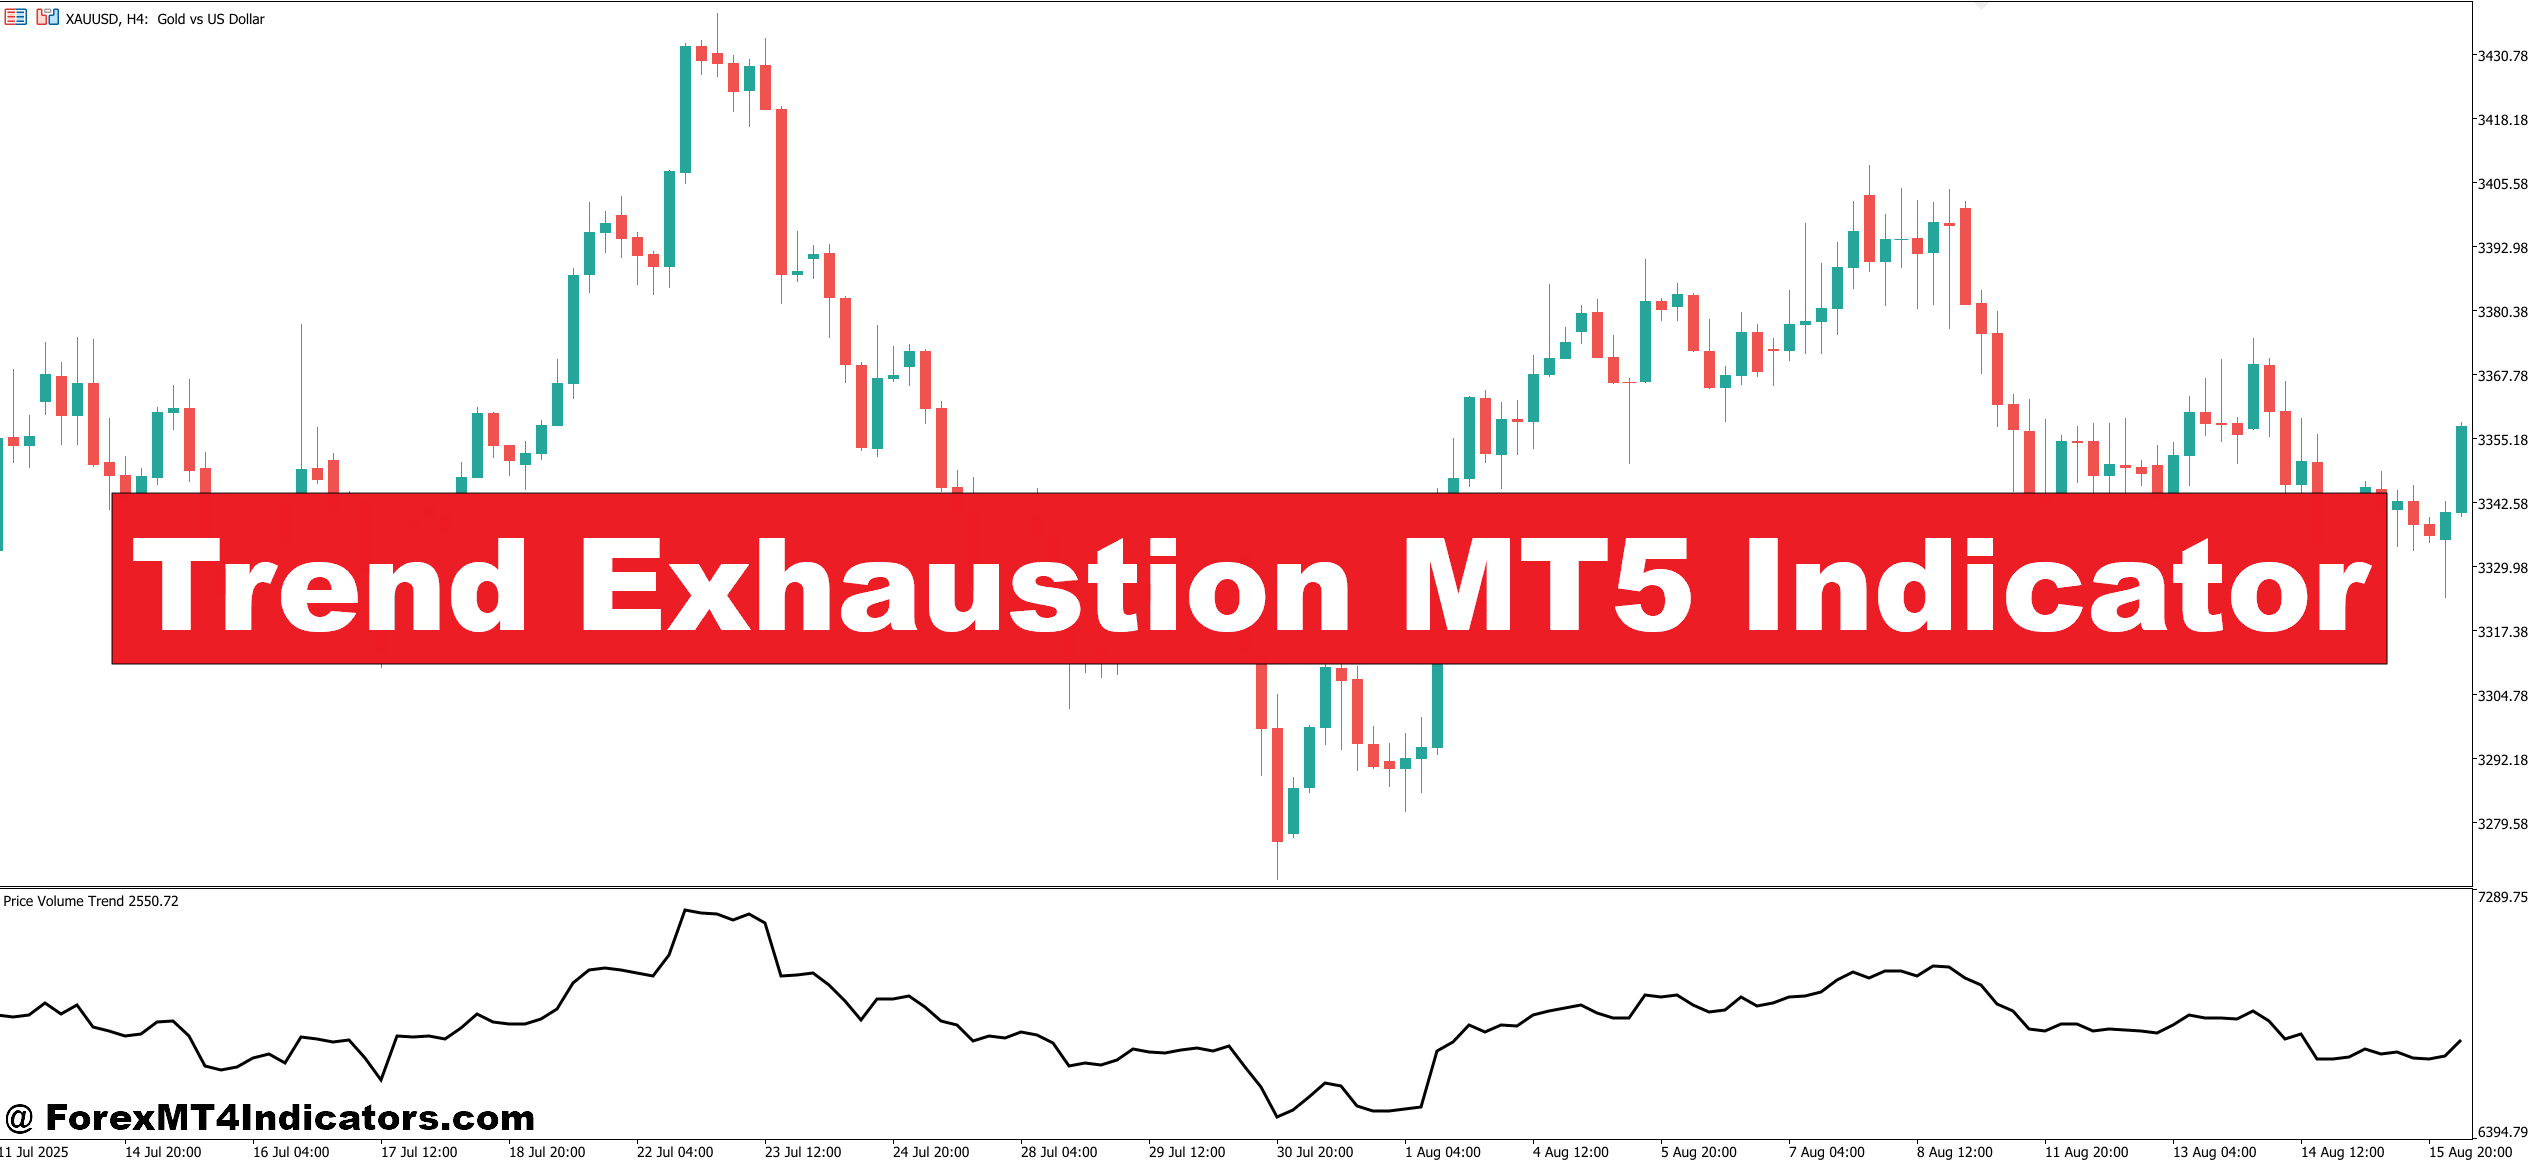
The Trend Exhaustion MT5 Indicator measures the declining force behind a price move. Think of it this way: price can keep climbing, but if each push higher requires more effort and produces smaller gains, the trend is aging. This indicator quantifies that aging process.
It typically combines elements of rate-of-change analysis with volatility measurement. Some versions use a modified momentum oscillator that tracks the acceleration (or deceleration) of price movement over a set lookback period — commonly 10 to 21 bars. When momentum slows relative to recent history, the indicator generates an exhaustion signal, often displayed as a colored dot, arrow, or histogram shift directly on the price chart or in a sub-window.
The key distinction here is timing. Standard momentum oscillators like RSI or Stochastic can stay overbought for extended periods during strong trends, leaving traders guessing. The Trend Exhaustion indicator focuses specifically on the rate at which momentum is fading, not just whether it’s high or low. That’s a meaningful difference when trying to time entries on potential reversals.
Practical Application: Using It in Live Market Conditions

Reading the Signals
Let’s say GBP/JPY has been trending up on the 4-hour chart for three consecutive days. Price has moved roughly 350 pips, and RSI sits at 74 — overbought, but not screaming reversal. The Trend Exhaustion indicator, however, starts printing warning signals because each successive 4-hour candle is producing diminishing upward momentum compared to the prior push. The trend looks alive on the surface, but under the hood, buyers are thinning out.
A trader watching this signal wouldn’t necessarily short immediately. But they might tighten a trailing stop on existing longs, skip adding to the position, or start watching lower timeframes for confirmation of a structural break.
That’s the practical value here — it’s an early warning system, not a standalone entry trigger.
Combining With Price Action
The indicator works best when paired with price structure analysis. For instance, if exhaustion signals appear right as price tests a known resistance zone — say, a weekly supply area on USD/CAD around 1.3850 — the confluence of exhaustion plus structural resistance creates a higher-probability setup than either signal alone.
During testing on the 1-hour EUR/USD chart around Non-Farm Payrolls releases, exhaustion signals that appeared before the news event often coincided with pre-event positioning unwinding. Traders who noticed the exhaustion reading alongside declining volume had a clearer picture of weakening conviction in the prevailing trend.
Trend Exhaustion MT5 Indicator Settings

Most versions of this indicator allow traders to adjust the lookback period and sensitivity threshold. Here’s what matters in practice:
Lookback period — A shorter period (8–12 bars) makes the indicator more reactive. Good for scalpers on the 5-minute or 15-minute chart, but expect more noise. A longer setting (18–25 bars) smooths things out and suits swing traders on the 4-hour or daily chart.
Sensitivity threshold — This controls how much momentum deceleration is required before a signal triggers. Setting it too low produces frequent warnings, many of which won’t lead to actual reversals. Too high, and the indicator only fires on extreme cases — useful, but rare.
For someone trading major pairs like EUR/USD or GBP/USD on the 1-hour timeframe, a 14-bar lookback with a moderate sensitivity setting tends to offer a reasonable balance between signal frequency and reliability. On cross pairs like EUR/NZD, which tend to be choppier, bumping the lookback to 18 or 20 helps filter out the extra noise.
There’s no universal “best” setting. It depends on the asset’s volatility profile and how the trader plans to use the signal — as a primary trigger or a secondary filter.
Strengths and Honest Limitations
Where It Shines
The Trend Exhaustion indicator fills a gap that many standard tools miss. Oscillators tell traders where momentum is relative to recent history, but this tool tells them how fast momentum is deteriorating. That distinction is useful for avoiding late entries into trends that are about to stall.
It also works across asset classes. Traders applying it to gold (XAUUSD) on the daily chart have noted that exhaustion readings near round-number psychological levels — $2,000, $2,050 — often preceded multi-day pullbacks.
Where It Falls Short
No tool predicts the future, and the Trend Exhaustion indicator is no exception. During strongly trending markets driven by macro catalysts — think central bank rate decisions or geopolitical shocks — exhaustion signals can fire repeatedly while price continues pushing in one direction. A trader acting on every signal in those conditions would get chopped up.
It also doesn’t account for volume in its standard form. On MT5, tick volume serves as a proxy, but it’s not the same as actual exchange volume data. This means the indicator can misread situations where thin liquidity, rather than genuine sentiment shift, causes momentum to fluctuate.
And here’s something worth saying plainly: this indicator won’t turn a losing strategy into a winning one. It’s a supplementary tool. Without sound risk management and a tested trading plan, no indicator — this one included — will protect a trader from consistent losses.
Trading forex carries substantial risk. No indicator guarantees profits, and past performance doesn’t predict future results. Always use proper position sizing and risk management.
How It Compares to Similar Tools
Traders sometimes compare the Trend Exhaustion indicator to the Williams %R or the DeMarker indicator, both of which also attempt to identify overextended moves. The main difference is specificity. Williams %R measures where the current close sits relative to the high-low range over a set period, which is broader in scope. DeMarker compares high-to-high and low-to-low changes, getting closer to the exhaustion concept but without the same focus on momentum deceleration rates.
The Trend Exhaustion indicator occupies a narrower lane — it’s purpose-built for one job: spotting when a move is running out of energy. That focus makes it less versatile but potentially more precise for that specific use case.’
How to Trade with Trend Exhaustion MT5 Indicator
Buy Entry

- Wait for the exhaustion dot below price – A signal dot or arrow appearing beneath a candle on the 1-hour or 4-hour chart suggests sellers are losing momentum and a bullish reversal may be forming.
- Confirm with a bullish engulfing candle – Don’t enter on the exhaustion signal alone. Wait for price action confirmation like an engulfing pattern or pin bar at the signal level before going long on pairs like EUR/USD or GBP/USD.
- Check the higher timeframe trend direction – If the daily chart still shows an intact uptrend, a buy exhaustion signal on the 1-hour chart carries more weight since it aligns with the broader trend as a pullback entry.
- Place stops 10–15 pips below the recent swing low – Tight stops get clipped by normal market noise. Give the trade room to breathe, especially during London or New York session overlaps when volatility picks up.
- Enter only near known support zones – An exhaustion signal sitting right on a key support level, like EUR/USD bouncing off 1.0800, has far better odds than a random signal in the middle of nowhere on the chart.
- Avoid buying during high-impact news releases – If NFP or a central bank decision is within 30 minutes, skip the signal entirely. Exhaustion readings get distorted by sudden liquidity spikes and wide spreads.
- Target 1.5 to 2 times your stop-loss distance – If your stop is 15 pips, aim for 22–30 pips profit. This keeps the risk-to-reward ratio in your favor even if only 50% of signals play out.
- Scale out at the first resistance level – Close 50% of the position at the nearest resistance and trail the remaining half. This locks in profit while leaving room for extended moves on pairs like GBP/JPY.
Sell Entry

- Look for the exhaustion signal above price – A dot or marker printing above a candle on the 4-hour or daily chart signals that buyers are running out of steam and a bearish reversal could follow.
- Confirm with a bearish rejection candle – A long upper wick or shooting star at the signal bar adds conviction. Entering a sell on GBP/USD without candlestick confirmation often leads to premature entries and unnecessary losses.
- Align with the higher timeframe downtrend – Selling into exhaustion on the 1-hour chart works best when the daily trend is already bearish. Selling against a strong daily uptrend is fighting the current, and most of those trades fail.
- Set stops 10–20 pips above the recent swing high – Place the stop just beyond the wick of the exhaustion candle. On volatile pairs like GBP/JPY, widen that buffer to 20 pips to avoid getting stopped on a brief spike.
- Don’t sell when price is sitting on major support – An exhaustion signal at the top of a range makes sense. But if price just tagged weekly support on EUR/USD near 1.0750, sellers are likely stepping into a wall of buy orders.
- Avoid trading during low-volume sessions – Exhaustion signals during the Asian session on EUR/USD or GBP/USD are unreliable. Thin liquidity produces erratic momentum readings that don’t reflect genuine sentiment shifts.
- Risk no more than 1–2% of your account per trade – Even a strong exhaustion signal can fail. Keeping position size controlled means one bad trade won’t damage the account or shake your confidence for the next setup.
- Take partial profits at 20–25 pips on intraday setups – On the 1-hour chart, close half the position once it moves 20–25 pips in your favor, then move the stop to breakeven on the rest. This turns the remaining position into a free trade.
Final Thoughts
The Trend Exhaustion MT5 Indicator offers a targeted approach to one of trading’s most persistent challenges — identifying when a move is losing steam before the reversal becomes obvious. It provides early warnings by tracking momentum deceleration rather than simply flagging overbought or oversold levels. The tool pairs well with price action and structural analysis, particularly near established support and resistance zones. That said, it’s not immune to false signals during strong macro-driven trends, and it should never replace a disciplined risk management plan.
For traders who have been burned by late trend entries or held positions too long into reversals, adding an exhaustion filter to the analysis process is worth exploring. Start on a demo account, test across different timeframes, and see whether the signals align with the market conditions being traded. The best indicator is always the one a trader understands well enough to trust — and honest enough to question.
Already an XM client but missing out on cashback? Open New Real Account and Enter this Partner Code: VIP90
Recommended MT4/MT5 Broker
XM Broker

(Free MT4 Indicators Download)
![]()
Enter Your Email Address below, download link will be sent to you.
Share
What's Your Reaction?
 Like
0
Like
0
 Dislike
0
Dislike
0
 Love
0
Love
0
 Funny
0
Funny
0
 Angry
0
Angry
0
 Sad
0
Sad
0
 Wow
0
Wow
0