Breakout Probability Indicator MT5
The Breakout Probability Indicator MT5 was built around that exact frustration, giving traders a way to filter out the noise before committing to a trade. This article covers how the indicator works, how to configure it properly, and — just as important — where it falls short. What the Breakout Probability Indicator Actually Measures At […]
The Breakout Probability Indicator MT5 was built around that exact frustration, giving traders a way to filter out the noise before committing to a trade. This article covers how the indicator works, how to configure it properly, and — just as important — where it falls short.
What the Breakout Probability Indicator Actually Measures
At its core, this MT5 tool analyzes historical price behavior around defined support and resistance zones to generate a probability score for a legitimate breakout. It doesn’t predict direction based on gut feel. Instead, it looks at factors like volume surges relative to the 20-period average, the distance price has consolidated before the breakout attempt, and how cleanly price is approaching the level (versus chopping back and forth, which tends to produce failed breaks).
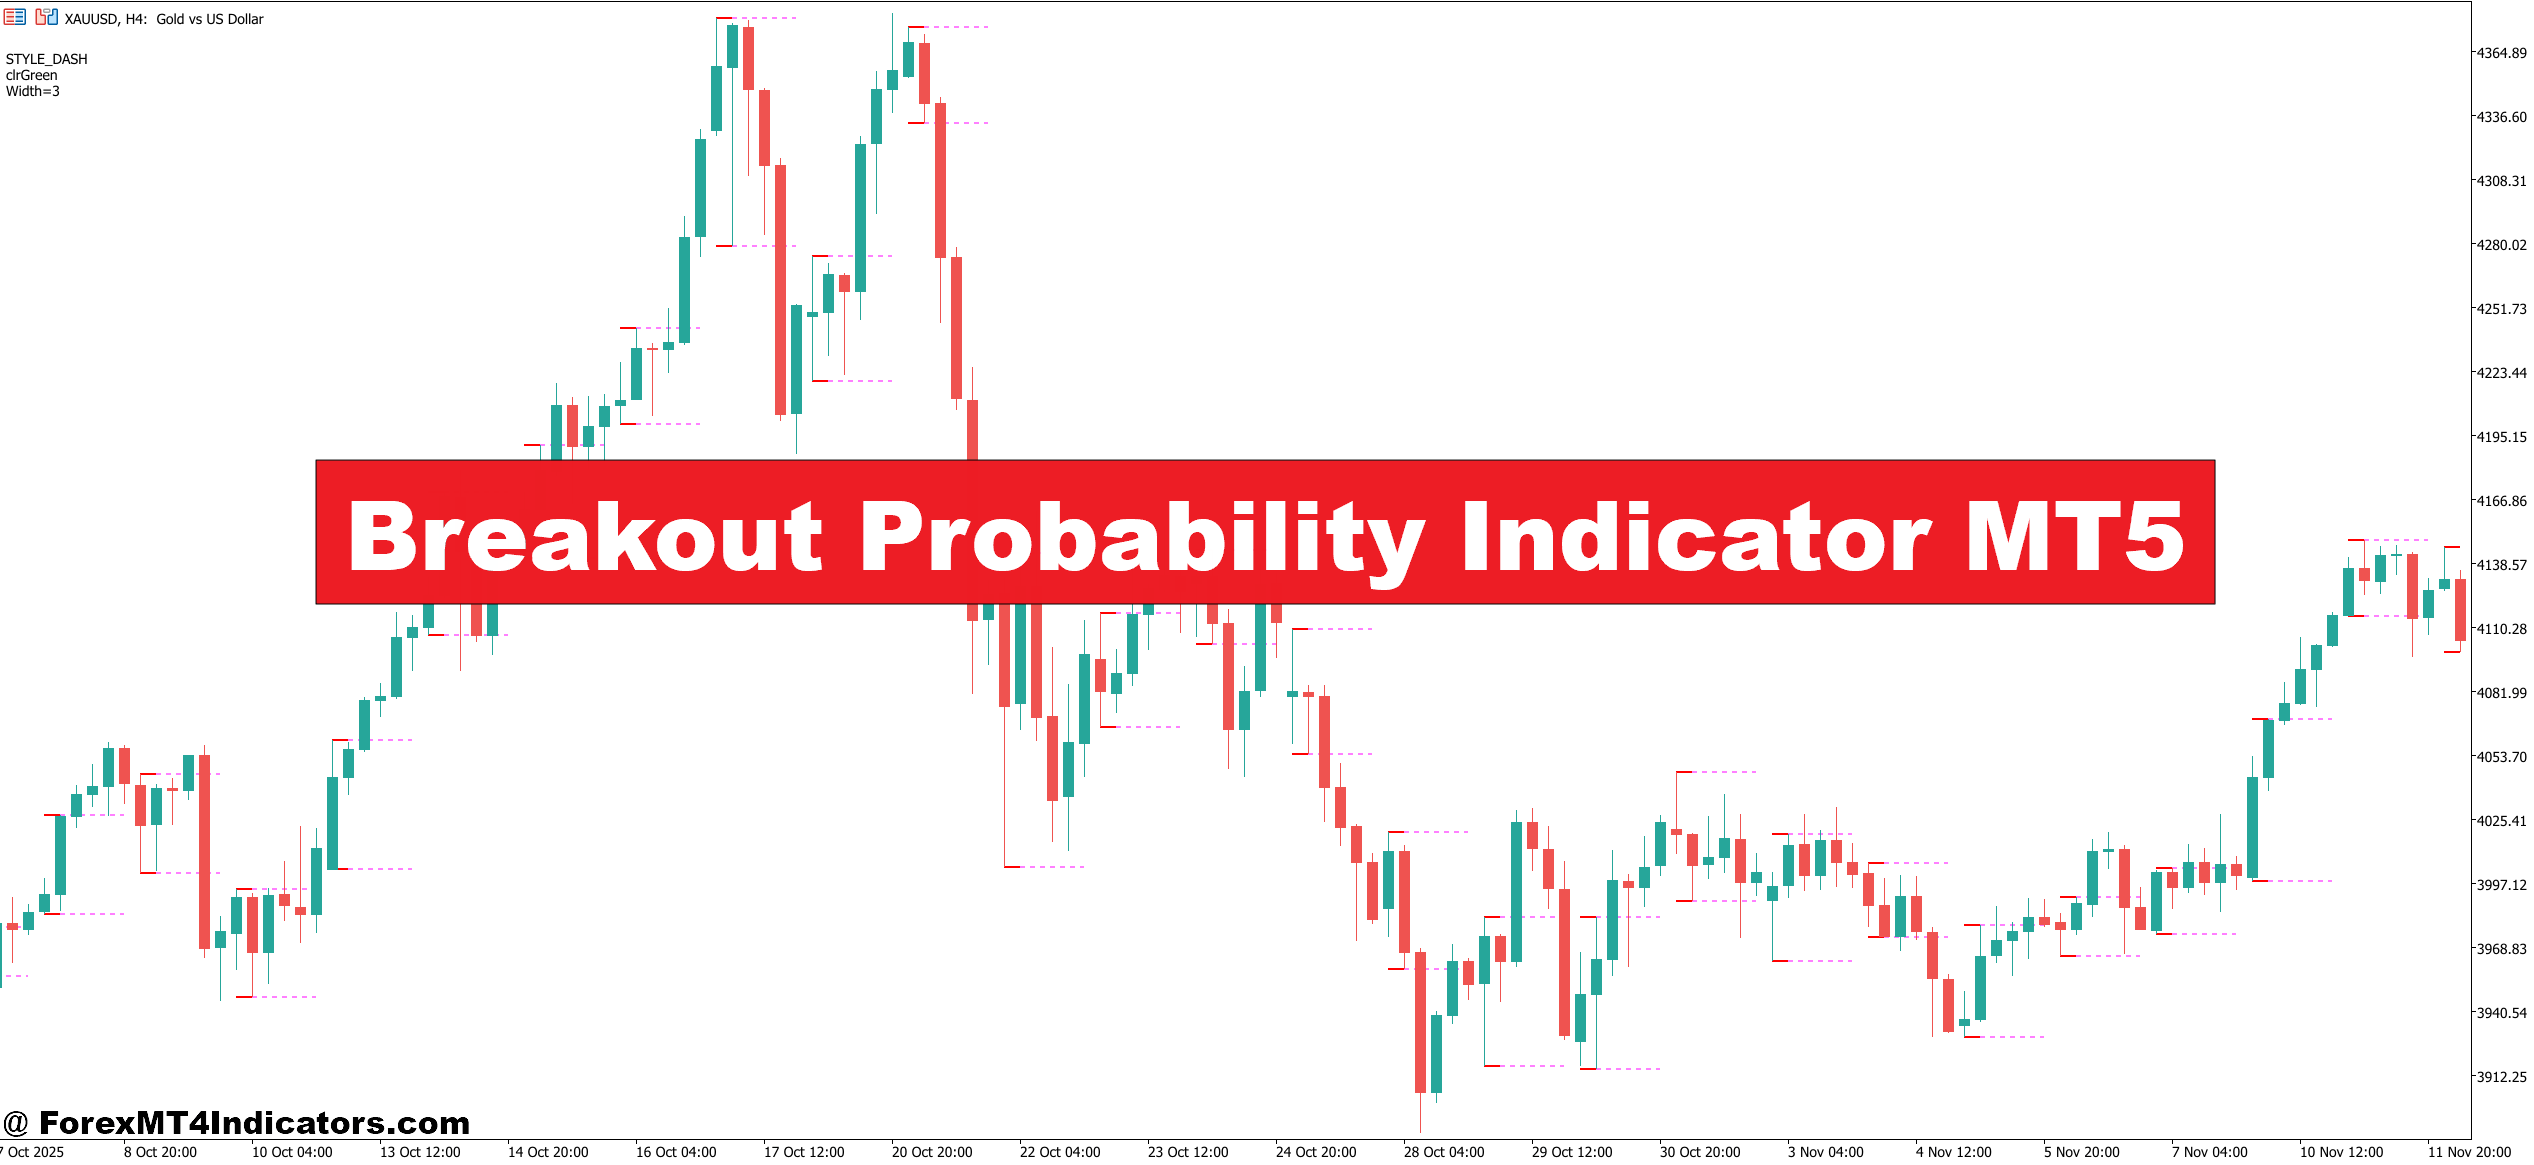
The output is typically displayed as a percentage score — say, 68% — overlaid on the chart near the breakout zone. Some versions also color the breakout candle itself: green shading for higher-probability setups, red or gray for low-confidence signals.
What makes this useful is the underlying logic. A breakout following a tight 15-candle consolidation with volume expanding 40% above average reads very differently from a breakout on light, drifting volume after a messy sideways chop. The indicator weighs these conditions and collapses them into a single readable number.
How Traders Apply It in Real Setups

Take EUR/USD on the 1-hour chart during a quiet London session. Price has spent roughly four hours building a range between 1.0845 and 1.0862. Volume is flat. The indicator shows a 34% breakout probability. Experienced traders know this is exactly the kind of setup where you wait — or fade the break if it comes.
Now contrast that with GBP/USD right after a higher-than-expected CPI print. Price breaks above the pre-news high on a big volume candle. The indicator prints 79%. That’s a setup worth considering — not guaranteed, but statistically the better trade.
Here’s the practical workflow most traders use with it:
First, they identify the key level manually — the indicator doesn’t replace the ability to read a chart. Then they watch for a breakout attempt and check the probability score before entering. Anything below 50% gets ignored unless there’s a compelling reason from the broader context. Above 65%, they’ll look for a pullback entry on the next candle or two rather than chasing the initial spike.
That said, during high-impact news events like NFP releases, the indicator can produce erratic readings because volume spikes sharply without the typical pre-breakout consolidation pattern it’s calibrated for. Most experienced users disable it or ignore its signals in the 30 minutes surrounding major data releases.
Breakout Probability Indicator MT5 Settings Worth Adjusting

The default settings work reasonably well on the 4-hour and daily charts for major pairs. But traders who primarily work on the 15-minute chart — especially on pairs like USD/JPY during the Tokyo session — often need to reduce the lookback period from the default 20 candles down to 10 or 12. Otherwise the indicator is pulling in too much context and reacting slowly to fast-moving intraday setups.
A few parameters worth knowing:
Volume Sensitivity: Controls how much weight the indicator places on volume relative to the price pattern. Raising this setting on thin-market pairs like exotic currencies can filter out false signals effectively. Lowering it makes the tool more responsive but noisier.
Consolidation Threshold: Defines how many candles of tight price action qualify as a “pre-breakout base.” Shorter thresholds are better for scalpers; longer ones suit swing traders looking for higher-conviction setups.
Signal Display Mode: Some builds offer alerts via MT5’s native notification system, which is useful if traders aren’t watching the screen constantly.
Honest Limitations

The indicator struggles in trending markets where price breaks levels repeatedly as part of a sustained move. In those conditions, every push through a prior high looks like a “breakout,” and the tool can produce high probability scores repeatedly — most of which are just continuations in a trend, not fresh explosive moves. Traders need to layer in trend context separately, whether through a simple 50-period moving average or basic price structure analysis.
It also doesn’t account for correlated pairs or macro context. A 72% breakout probability on USD/CAD means a lot less if crude oil is imploding simultaneously and you haven’t accounted for it.
No indicator replaces judgment. Trading forex carries substantial risk. No tool — including this one — guarantees profits, and probability scores are statistical tendencies, not certainties.
How to Trade with Breakout Probability Indicator MT5
Buy Entry

- Wait for 65%+ probability score – Below this threshold, the breakout has weak historical follow-through and isn’t worth the risk.
- Confirm volume expansion – The breakout candle should show at least 30-40% above the 20-period average volume before entering long.
- Enter on the pullback – After the initial break, wait for price to retest the broken level on EUR/USD or GBP/USD before placing the buy order.
- Use the 1-hour or 4-hour chart – These timeframes produce cleaner signals; avoid relying on this indicator below the 15-minute chart.
- Set stop-loss 5-10 pips below the broken resistance – This keeps risk tight while giving the trade room to breathe.
- Target the next clean resistance zone – Aim for a minimum 1:2 risk-reward ratio before entering; don’t take the trade if it isn’t there.
- Skip signals during NFP or CPI releases – Volume spikes distort the probability score in the 30 minutes surrounding major news events.
- Look for a prior consolidation of 10+ candles – Tighter bases before the breakout produce stronger follow-through on long setups.
Sell Entry

- Require 65%+ score on the downside break – A low-probability breakdown on GBP/USD or EUR/USD is usually just a wick, not a real move.
- Watch for volume to confirm the selling pressure – A breakdown candle without volume expansion above the 20-period average is a red flag.
- Enter short on the retest of broken support – Price frequently pulls back to the underside of the broken level — that’s the cleaner entry with a tighter stop.
- Use the 4-hour or daily chart for swing shorts – Intraday breakdowns on the 15-minute chart carry more whipsaw risk and produce noisier readings.
- Place stop-loss 5-8 pips above the broken support level – Keeps the trade invalidation point logical and avoids getting stopped by normal spread fluctuation.
- Avoid shorting into major round numbers – Levels like 1.0800 on EUR/USD attract heavy buying interest and can kill a breakdown trade fast.
- Don’t short when the broader trend is strongly bullish – A 70% breakdown score in a clear uptrend still loses more often than it wins without trend alignment.
- Target the next visible support zone – Project the move before entering; if the nearest support is only 10 pips away, the trade doesn’t offer enough reward to justify the risk.
How It Compares to Standard Breakout Tools
Traders who’ve used Donchian Channels or the classic ATR-based volatility breakout systems will notice a difference. Those tools fire on price clearing a defined threshold. They don’t weight the quality of the setup. The Breakout Probability Indicator MT5 adds a layer of context that pure price-level tools don’t — it’s trying to answer not just did price break out but should I care.
Compared to the Bollinger Band squeeze setups many traders use, this indicator is more explicit about quantifying confidence. A tight Bollinger Band tells you a big move is coming; it doesn’t tell you whether the eventual breakout has historical follow-through behind it. That’s where this tool adds something genuinely different.
Already an XM client but missing out on cashback? Open New Real Account and Enter this Partner Code: VIP90
Recommended MT4/MT5 Broker
XM Broker

(Free MT4 Indicators Download)
![]()
Enter Your Email Address below, download link will be sent to you.
Share
What's Your Reaction?
 Like
0
Like
0
 Dislike
0
Dislike
0
 Love
0
Love
0
 Funny
0
Funny
0
 Angry
0
Angry
0
 Sad
0
Sad
0
 Wow
0
Wow
0